Paddock map
Your farm on a map, with every mob in its paddock.
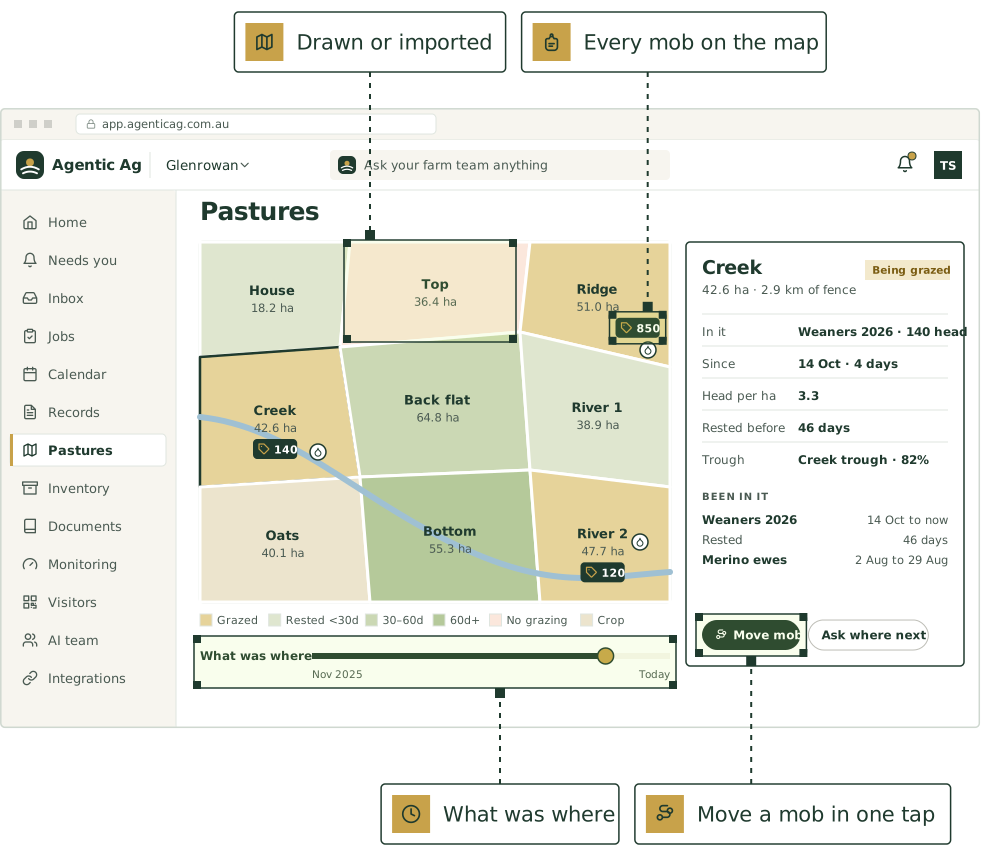
Draw paddocks on satellite imagery, or bring them in from Google Earth, Mobble or AgriWebb. The map shows where every mob is, and how long each paddock has rested.
- Draw or import
- Satellite imagery
Map your farm
Three steps, on a new farm or an old one.
Paddocks already in your records show as “not on the map yet” until they’re drawn.
- Step 1
Find the farm
Search for the nearest town, or use where your phone is.
- Step 2
Draw the boundary
Tap round the farm, then the home block, outblocks and leased country.
- Step 3
Draw or bring in paddocks
Tap their corners, or import KML, KMZ or GeoJSON, matched to your paddocks by name.
- Then
Move mobs, watch the rest
Every move fills in the map’s history and the grazing chart.
Colour by grazing
- Being grazed
- Rested under 30 days, 30 to 60, or over 60
- No grazing, from a spray or a withholding restriction
- Crop or hay, and yards
Or colour by land use. A legend counts each.
Who can do what on it
Everyone on the farm can look, contractors included. Owners and managers draw the farm and its places; anyone else who adds records can draw paddocks and points.
Ask the team where to go next
From a paddock, ask where the stock should go. It looks at how long each paddock has rested, and asks first before it records a move.
The whole grazing picture, on one screen.
Draw a paddock
Tap its corners and the area and fence length work themselves out. Corners snap to fences already drawn, so neighbours line up.
Bring in your shapes
KML, KMZ or GeoJSON from Google Earth, Mobble, AgriWebb or your agronomist, up to 200 at a time, matched to your paddocks by name. Nothing saves until you say so.
Every mob on the map
Each paddock shows its name, area and the mobs in it. Tap one for head per hectare and how long it rested, and move a mob from there in one tap.
What was where
Slide back through the year to see which mob was in which paddock that day, and how long each had rested.
A grazing chart
A row per paddock and a bar per mob, with the rest days written in the gaps, over 3 months, 6 months or a year.
Troughs, dams and gates
Place up to 500 points with a tap. Link a trough, tank or dam to its sensor and its level shows on the map.
The agents that keep it.
Each keeps its part current, asks before anything that matters, and hands work to the others.
Pasture manager
Feed budgets, rotations, mob moves

Map keeper
Keeps the paddock, block and infrastructure map, and the names people actually use

Grazing chart keeper
Grazing and rest days per paddock, stocking rate and DSE/ha

Ground cover watcher
Ground cover and erosion risk from satellite, against your targets

Stockperson
Mob records, treatments, withholding periods
Good first jobs
Jobs the team does with it.
Ask which paddocks are rested and ready
When: “Which paddocks are ready to graze?”
You get: Paddocks ready, nearly ready and restricted, with rest days against target; the latest cover figure where there is one
Find the next paddock before feed runs out
When: Paddock feed falls below target
You get: Proposed mob move with reasons
Match the names people use to the map
When: Someone mentions a paddock name that isn’t on the map, like “the bull paddock”
You get: The nickname saved against the right paddock, so records land in the right place
Catch stock moved into a paddock that’s being spelled
When: A mob move is logged in a paddock with a ground cover restriction on it
You get: An alert naming the mob, the paddock and why it’s spelled; the cover it was resting for; options to move them
Total the year’s grazing days per hectare by paddock
When: 1 July, for the year just finished
You get: A table of every paddock: DSE grazing days per hectare, times grazed, rest days; paddocks well above or below the farm average; a short note for the pasture and renovation plans
Send the header contractor a marked-up map
When: A week before a contractor booking on the jobs list
You get: One-page map PDF for the crew; hazard list by paddock; gaps where the map has nothing

Use ours, or keep yours
Already use other software for this? Keep it.
Paddock shapes from Google Earth, Mobble and AgriWebb come in as KML, KMZ or GeoJSON files today. Here’s where each direct connection is up to.
AgriWebb
Once it’s connected, the team reads your mobs, animals and paddocks from AgriWebb, so you don’t key anything in twice.
Mobble
The team would read your mobs, paddocks and treatments from Mobble, so nothing is keyed in twice.
FarmMap4D
Your property map, paddocks and infrastructure would come in, with pasture and ground cover over time.
MaiaGrazing
Grazing plans and stock and pasture records from MaiaGrazing would sit alongside everything else.
Sentinel satellite imagery
If we get access, you’d see greenness (NDVI, a satellite measure of plant growth) and moisture for each paddock every few days, compared over time.
Put [AGENT NAME] to work on your farm.
We’re taking a small number of pilot farms in [REGION]. Start with one or two agents and add more as you go.
See it on a farm like yours.
30 minutes with Thomas, our founder, on records like your own.
Livestock, paddocks, visitors and tanks, in one place.
The farm management software comes with every plan. Keep the software you already use, or use ours.
Not ready yet? Start with a free calculator.
The sums you do every week, for stock, pasture, crops and the books. No sign-up.
Watch a job before you commit.
Pick a playbook and see it play out, step by step.